
Designing a drone powertrain: motor, propeller and battery
A walk through sizing the propeller, motor KV, battery and cell count for a multirotor, the physics behind each choice and the constraints that end up deciding the design, with live calculator examples.
A multirotor’s powertrain is the chain that turns stored energy into thrust: battery → ESC → motor → propeller. Choosing its parts is a balancing act. Every gram you add has to be lifted, a bigger battery gives more energy but also more weight, and a motor that hovers efficiently may not have the headroom to climb or fight wind.
This post works through a complete design, explains the physics at each step, and shows which constraints end up deciding the answer. The live panels are our free Drone Powertrain Calculator: every slider in them works, so change the numbers and watch the trade-offs move.
The example: a 10-inch research quad
Our example is the kind of vehicle a lab or a classroom might build: a quadcopter with 10-inch propellers, a GPS, a camera and a Raspberry Pi 5 as the companion computer (on a flightHAT, say). The fixed inputs are:
| Input | Value | Why |
|---|---|---|
| Dry mass (everything except the battery) | 1100 g | frame, 4 motors of 55 g, props, ESCs, electronics, camera |
| Propeller diameter | 10 in | the largest the frame allows |
| System power (everything except the motors) | 12 W | flight controller, Pi 5, camera, radio |
| Max thrust-to-weight target | 2 : 1 | enough for a calm research platform; more for wind or payload |
| Battery specific energy | 150 Wh/kg | typical for a LiPo pack |
As a first guess we start with a 4S 5000 mAh pack and KV 900 motors with 10 × 4.5 props. The rest of the post is about making those choices properly.
Step 1: weight sets the thrust
In a steady hover the propellers carry the whole weight, shared equally between the motors. The hover thrust per motor is
where is the take-off mass, battery included. With our first-guess battery (74 Wh, 493 g) the vehicle weighs 1593 g, so each motor must make 398 g of thrust in hover.
Hover is only half the requirement. To climb, turn and recover from gusts the vehicle needs thrust in reserve, expressed as the thrust-to-weight ratio at full throttle:
A ratio of about 2 is a common floor for camera and research platforms: it leaves the motors hovering near half throttle. Agile vehicles use 3 to 4, and racing quads go far higher. The hover point and the T/W target together set the two operating points every part has to meet.
Step 2: the propeller does the real work
A propeller’s static thrust and power follow from dimensional analysis. With air density , rotation rate (rev/s) and diameter :
The coefficients and depend on the propeller’s shape (pitch, blade count, airfoil) and are what propeller test data measures.
The more useful insight comes from momentum theory. A rotor of disk area makes thrust by accelerating air downward, and the least power that can possibly produce thrust is
Real propellers need more than this. The ratio is the figure of merit, , typically 0.5 to 0.75 for small drone propellers. For our quad:
Two lessons fall straight out of that equation:
- Bigger propellers are more efficient. At a fixed thrust, ideal power falls as , because a larger disk moves more air more slowly. This is the single strongest lever in the whole design.
- Power grows faster than weight. At a fixed propeller, hover power rises as : carrying 10 % more mass costs about 15 % more power.
Here is what the diameter lever is worth for our quad, with KV adjusted so each version hovers near the same throttle:
| Propeller | Hover rpm | Hover efficiency | Hover time |
|---|---|---|---|
| 8 × 4.5 | 7,875 | 7.5 g/W | 15.6 min |
| 9 × 4.5 | 6,378 | 8.6 g/W | 17.8 min |
| 10 × 4.5 | 5,294 | 9.6 g/W | 19.9 min |
| 11 × 4.7 | 4,432 | 10.7 g/W | 21.8 min |
| 12 × 4.5 | 3,855 | 11.7 g/W | 23.8 min |
So the first rule is simple: use the largest propeller the frame allows. Our frame stops at 10 inches, and that is our first binding constraint.
The upper limit on any propeller is its tip speed. As the blade tips approach the speed of sound, compressibility losses and noise climb steeply, so designers keep the tip below about Mach 0.7 at full thrust:
With m/s, a 10-inch prop may turn up to about 17,900 rpm. Our hover at 5,300 rpm is far below it (tip Mach 0.21), so tip speed isn’t a constraint here. It matters for small, fast props and for large, heavy-lift ones.
Pitch is a much weaker lever than diameter. A higher pitch makes more thrust per revolution, so the same thrust comes at a lower rpm, but with the motor KV re-matched the hover efficiency barely changes. Treat pitch as a way to match a propeller to a motor, not as an efficiency knob.
Try it below: change the diameter, pitch or blade count and watch the efficiency curve (left axis) and the power needed (right axis). The dot marks the hover point.
Step 3: matching the motor (KV)
A brushless motor turns current into torque and voltage into speed. Its KV rating is its no-load speed per volt, and the same constant links current to torque:
Here is the propeller’s torque, the no-load current (friction and iron losses), the winding resistance and the speed in rad/s (with in rad/s per volt). The propeller fixes the hover speed and torque, so the motor’s job is to deliver them at a sensible throttle and with low losses. The main loss is heat in the windings, , so for the same mechanical power, less current means less waste.
KV decides where the hover falls in the motor’s range. With our 10-inch prop on 4S, the hover needs 5,300 rpm whatever the KV; what KV changes is the throttle needed to get there, and therefore the reserve left above it:
| Motor KV | Hover throttle | Max T/W | Hover current per motor | Hover time |
|---|---|---|---|---|
| 500 | 78 % | 1.6 | 3.5 A | 20.1 min |
| 700 | 56 % | 2.8 | 4.8 A | 20.0 min |
| 900 | 44 % | 4.0 | 6.2 A | 19.9 min |
| 1100 | 36 % | 4.7 | 7.6 A | 19.7 min |
Two things stand out. Hover efficiency hardly changes with KV: a lower KV draws less current, which helps a little. What KV really sets is the headroom. KV 500 fails the T/W target (1.6), and KV 1100 has so much reserve that full throttle would draw 125 A from the battery. KV 700 hovers at 56 % throttle, meets the target with margin (T/W 2.8) and draws 12.4 A per motor at full thrust, so a 20 A ESC covers it with a safety factor of about 1.5. That’s our motor.
The rule of thumb: pick the lowest KV that still meets the T/W target, aiming to hover at about 50–65 % throttle. The sweep below plots hover efficiency and max T/W across the KV range, with a dot at the current design; move the KV slider to slide it along the curves.
Step 4: sizing the battery
The battery’s energy and mass follow from its label. For cells in series of nominal voltage and capacity (Ah), with specific energy (Wh/kg):
Our 4S 5000 mAh pack holds Wh and weighs about 493 g. Flight time is the usable energy divided by the power drawn:
where is the usable fraction (we use 80 %, to land with charge left). With KV 700 that gives 20 minutes.
A bigger battery is not free, and momentum theory tells us exactly how it pays. Hover power grows as mass to the 3/2 power, so with dry mass :
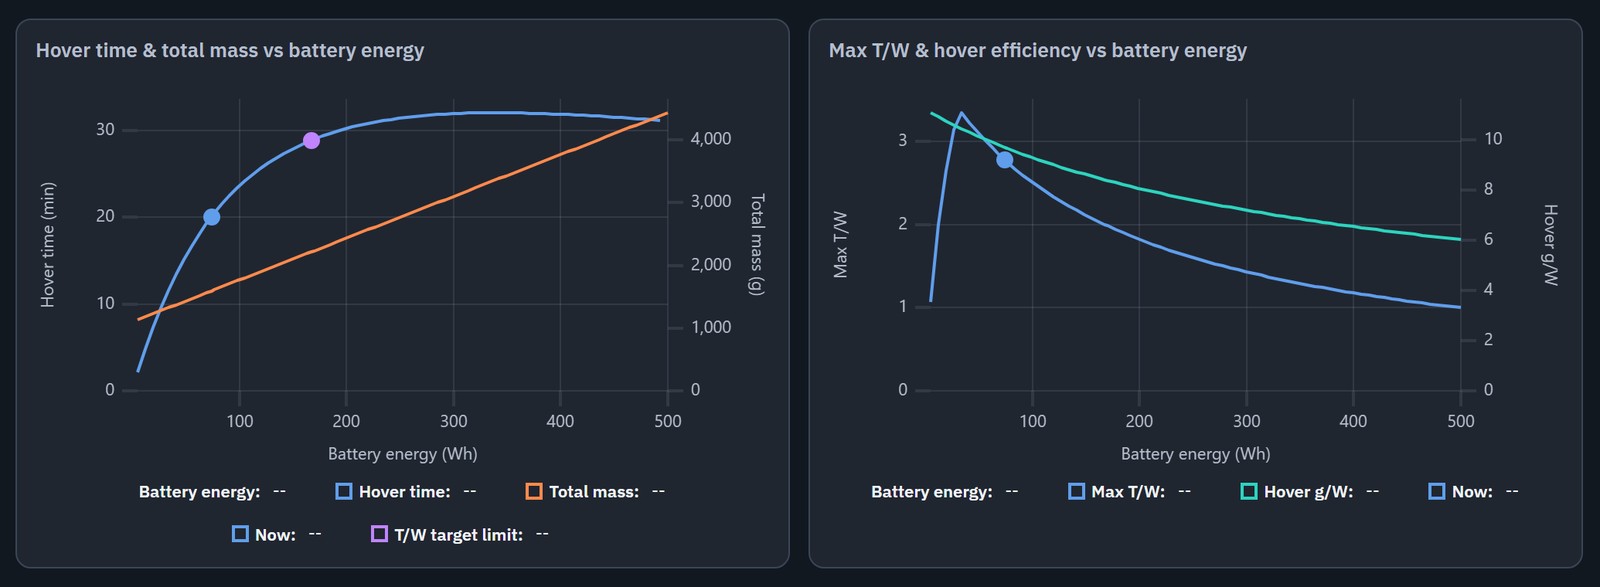
Hover time keeps rising until the battery weighs twice everything else, then falls. For our 1100 g airframe that’s a 2.2 kg, 330 Wh pack, and the calculator’s battery sweep peaks at almost exactly that point, about 32 minutes.
Nobody builds that drone, though, because by then the other constraints have long been broken:
- Thrust-to-weight. Adding battery raises the weight but not the maximum thrust, so T/W falls. With KV 700 it reaches our limit of 2 at about 166 Wh (2.2 kg take-off mass, 29 min).
- Diminishing returns. Going from 74 to 166 Wh more than doubles the battery but adds only about 43 % more hover time, and every extra gram makes the vehicle less agile and harder to stop.
- Discharge rate. A pack can only deliver its C rating times its capacity: . Our 25C 5000 mAh pack allows 125 A against a full-thrust draw of about 52 A, comfortably inside it. Small packs on powerful motors are where this bites.
In practice designers settle well before the peak, typically with the battery at 30–40 % of the take-off mass. Drag the capacity slider: the left chart shows hover time rising and then falling, with the purple marker at the largest pack that still meets the T/W target; the right chart shows T/W and efficiency falling as the pack grows.
Step 5: choosing the voltage
Electrical power is , so the same power can come from a high voltage at low current or a low voltage at high current. Because winding, ESC and wiring losses grow as , a higher voltage wastes less. The motor KV must come down in proportion, so the propeller still turns at the same speed.
Holding the pack energy at about 74 Wh and re-matching KV for each cell count:
| Pack | Motor KV | Hover current per motor | Full-thrust battery current | Hover time |
|---|---|---|---|---|
| 3S 6600 mAh | 930 | 6.4 A | 67 A | 19.7 min |
| 4S 5000 mAh | 700 | 4.8 A | 52 A | 20.0 min |
| 6S 3300 mAh | 470 | 3.2 A | 36 A | 20.0 min |
At hover the gain is small, because hover currents are modest. The real benefits of more cells are halved currents at full thrust, which means smaller ESCs, thinner wires and cooler connectors, plus less voltage sag under load. The limits are the voltage rating of the motors, ESCs and the rest of the electronics, and whether a motor is sold in a low enough KV. For a quad this size, 4S to 6S are all reasonable; 2S and 3S start to push currents up.
Step 6: count the electronics
The motors are not the only load. The flight controller, radio, camera and especially a companion computer all draw from the same battery. A Raspberry Pi 5 alone uses roughly 3 W at idle and around 10 W under full CPU load. That’s small next to 160 W of hover power, but it comes straight out of flight time:
Our 12 W of electronics cost about 7 % of the flight time, worth knowing before adding a bigger computer or a second camera.
Putting it together: let the optimizer search
Each step above changes one variable at a time. The calculator’s Optimize tab searches them together: it holds the airframe, propeller diameter, system power and T/W target, then tries thousands of combinations of cell count, KV, pitch, blade count and pack size for the longest hover. It also respects a tip-speed limit, a motor-current limit and a cap on the battery’s share of the take-off mass (40 % by default).
For our quad it lands on 6S, KV 370 and a 110 Wh pack (about 4950 mAh) driving a two-blade 10-inch prop, for about 24.7 minutes of hover, up from 20 minutes for our hand-tuned 4S design. The result lists the two binding constraints: the battery is exactly 40 % of take-off mass, and the T/W is just above 2. That’s typical: the answer is almost always pinned by T/W and battery share, not by anything clever in the motor or propeller. The runner-up designs (5S, 4S, 3S) are all within half a minute of it; only 2S falls behind, at 23.5 minutes with more than twice the current of the 4S design.
The constraints, in one place
| Constraint | What it limits | Typical value |
|---|---|---|
| Frame size | Propeller diameter, the biggest efficiency lever | set by the airframe |
| Thrust-to-weight | Battery size, KV (too low fails it) | 2 for camera and research, 3–4 agile, more for racing |
| Hover throttle | KV and voltage | 50–65 %, leaving reserve for control |
| Tip speed | Propeller rpm | below Mach 0.7 at full thrust |
| Battery share | Battery mass | around 30–40 % of take-off mass |
| Discharge rate | Smallest usable pack | above full-thrust current |
| Motor and ESC current | KV and voltage | ESC rated about 1.3–1.5 × the full-thrust motor current |
| Voltage rating | Cell count | motors, ESCs and electronics |
How far to trust the numbers
The calculator uses a generic model: motor resistance and no-load current are estimated from KV and mass, and the propeller from its diameter, pitch and blade count, with coefficients fitted to published propeller data. Checked against a manufacturer’s thrust-stand tables for a 12-inch propeller it comes out about 10 % low on power, and small propellers (6 inches and under) are less efficient than it assumes: there, expect real hover power 15–20 % higher. Treat the results as a way to compare options and find the right region, then check the final choice against the motor and propeller makers’ thrust-stand data, or your own.
Things the model leaves out: forward flight (it’s a hover model), wind, temperature effects on the battery, and the change in motor losses with speed.
Further reading
- Tyto Robotics: How to choose the right motor and propeller for your drone, the drone design loop and how to increase drone flight time, a worked design loop with thrust-stand data
- Mark Drela, DC motor and propeller matching: the motor and propeller equations used here
- UIUC Propeller Data Site: measured thrust and power coefficients for hundreds of propellers
- SizingLab multirotor course: propeller coefficient regressions and system-level sizing